🚀
Get Started
Jump right into analyzing your peptidomic data with our powerful tools
To learn more about the process, see the workflow below and explore our visualization examples
⚙️ Workflow
Data Transformation
Organize, label, annotate and explore your peptidomic data with the data transformation tool
Descriptive Analysis
Explore your data and generate visualizations through interactive plots
Heatmap Visualization
Generate customizable heatmaps for site-specific peptide-protein mapping
📈 Visualizations
Explore Different Plot Types
Discover the best visualization formats to easily reveal insights from your data
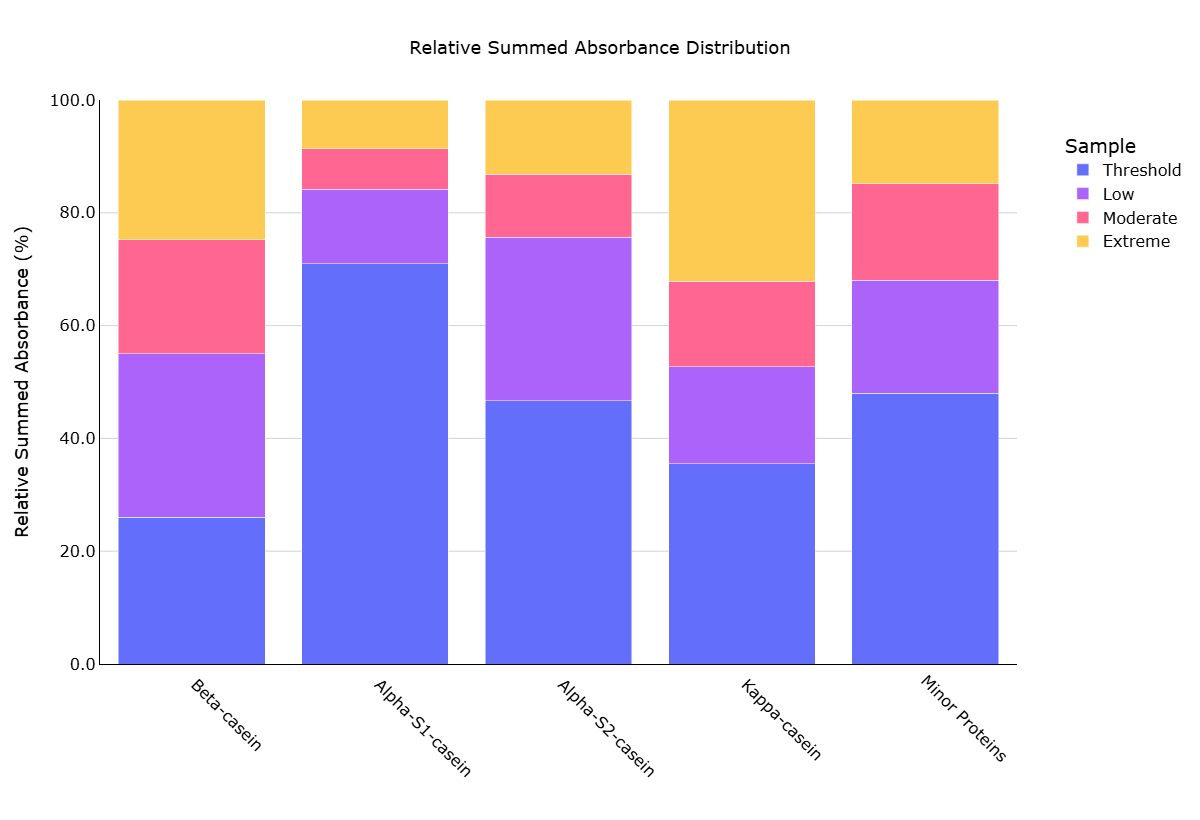
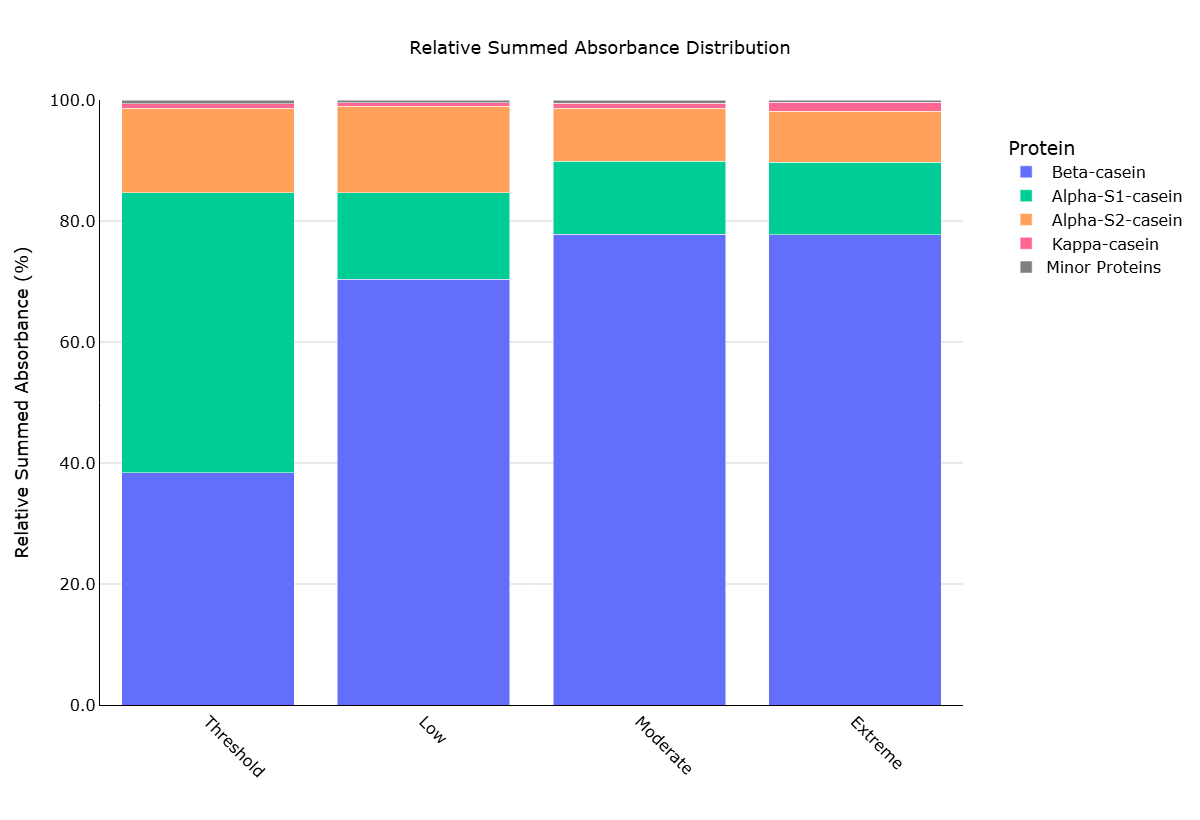
Stacked Bar Plots
Easily visualize both absolute and relative abundance distributions to understand the trends within and across samples proteins or functional categories
Sequence Heatmaps
Identify key regions of peptide or functional distribution with in a protein(s) illustrating site specific peptide absorbance and peptide counts
Pie Charts
Identify relationships within each sample, functional categories or protein origin with interactive pie charts
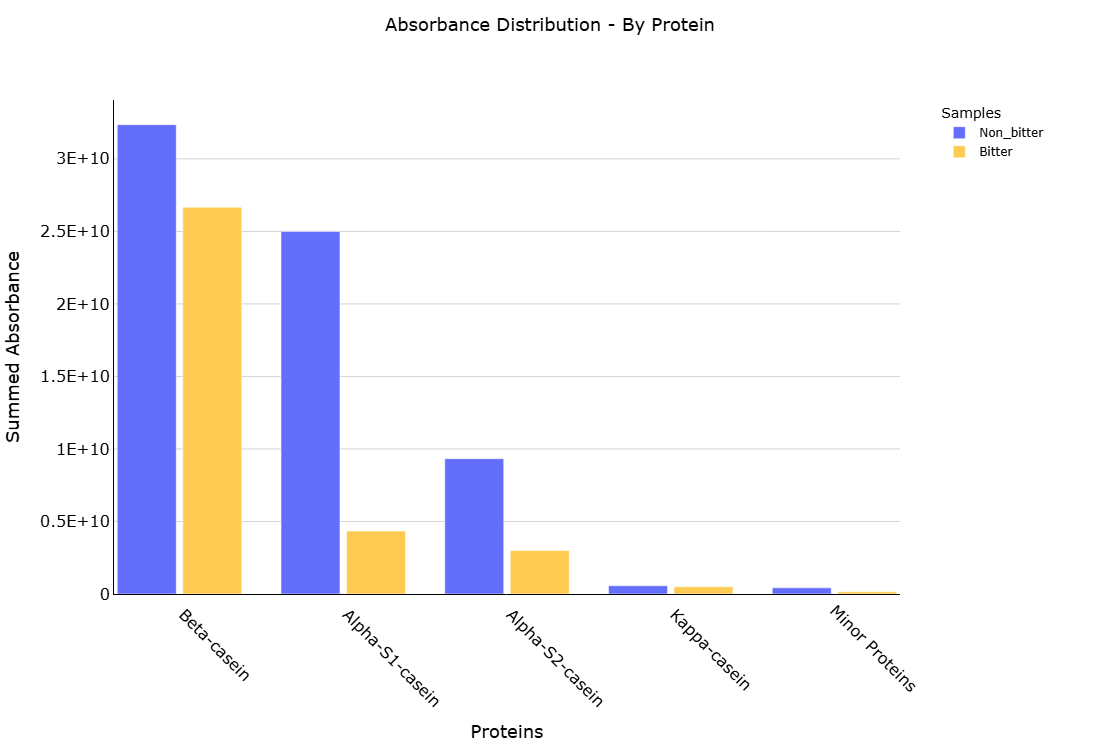
Grouped Bar Plots
Grouped bar plots showing peptide abundance by protein origin (or function) across samples
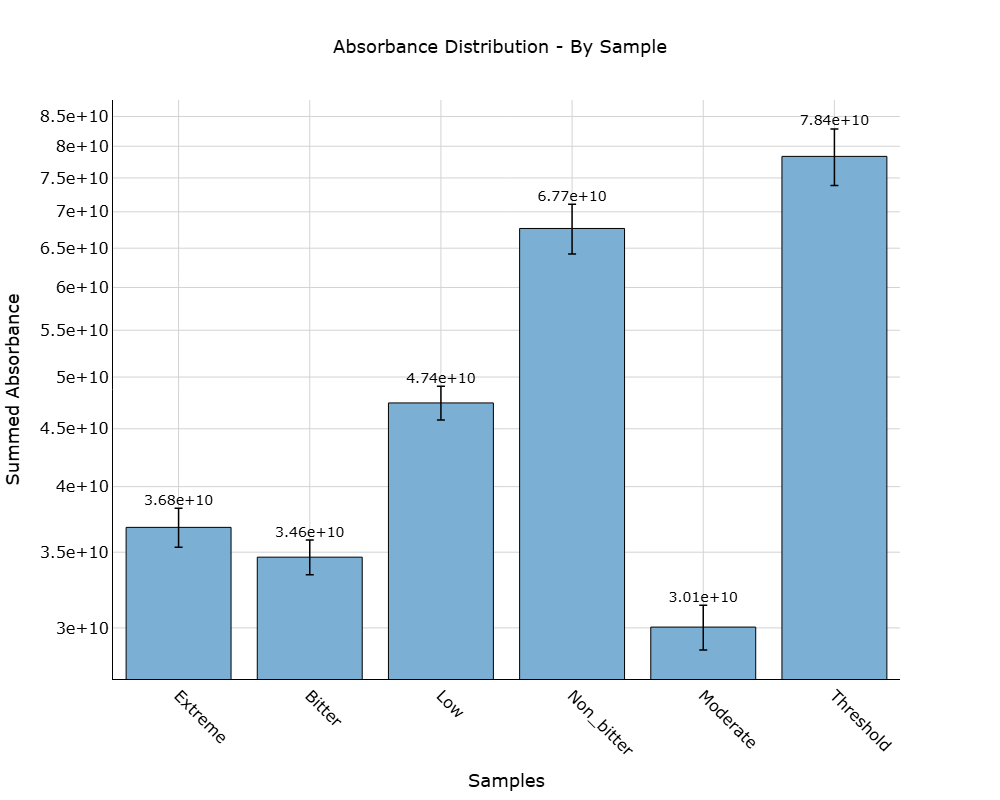
Summary Bar Plots
Total peptide counts and abundance summaries with statistical error bars to understand the overall distribution of your data
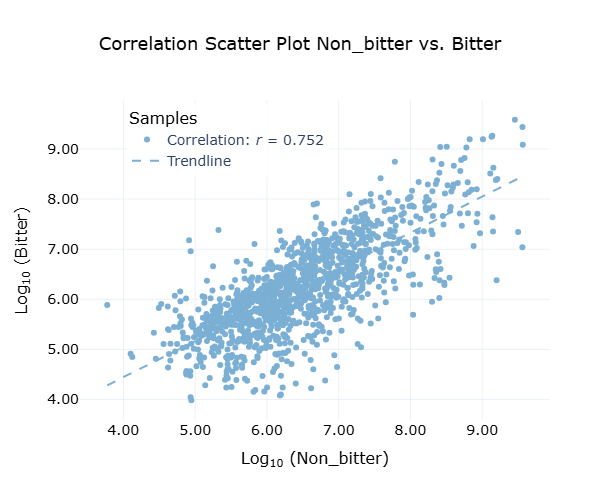
Correlation Scatter Plots
Identify correlations between samples with our interactive scatter plots and SPLOM ploting options
Explore Data Scaling and Orientations Options
Discover insights through diverse data transformations and visualization options
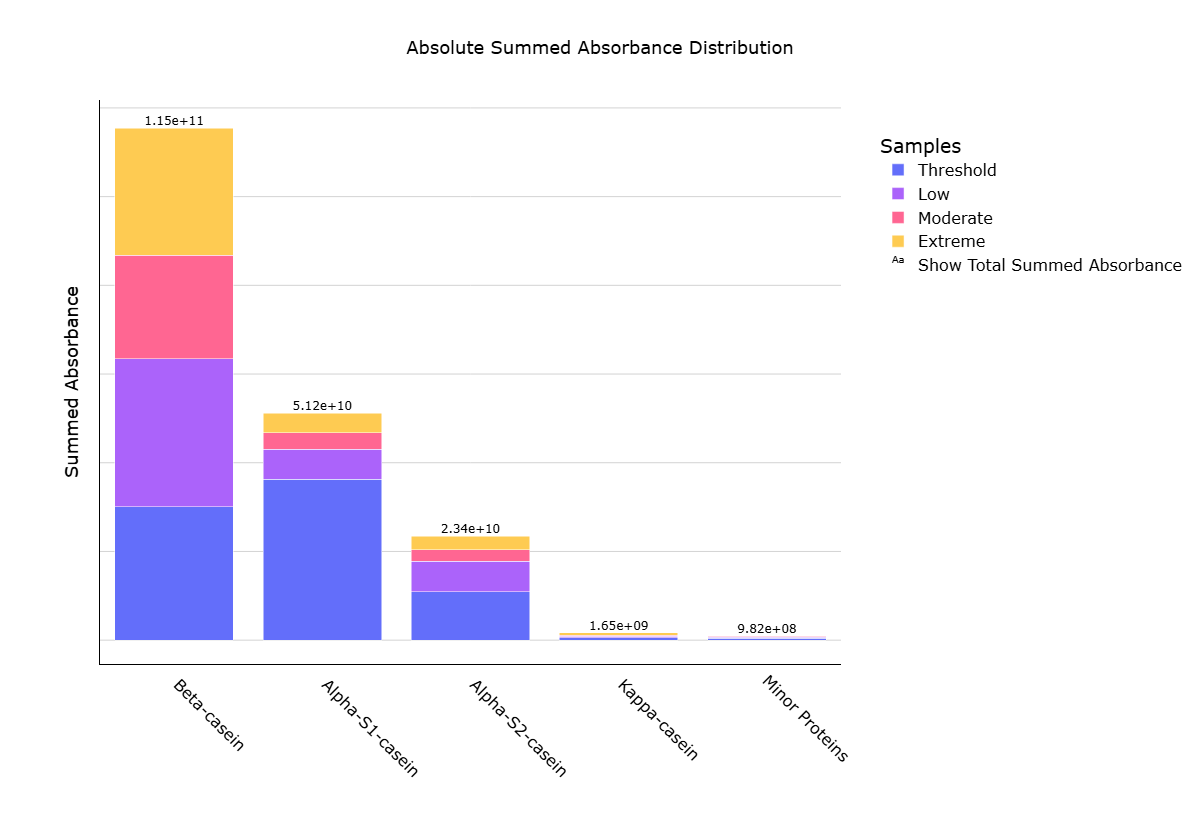
Absolute Summed Abundance
Absolute abundance distribution comparing the total peptide contribution by protein orgin or function across groups and relative contribution within each group
Relative Abundance by Protein
Relative abundance distribution showing protein (or function) contribution percentages across samples
Relative Abundance by Sample
Relative abundance distribution showing sample-specific protein (or function) contributions
Get Started to Explore Even More Visualization Options
Ready to dive deeper? Access our full suite of customizable interactive visualization tools